Flightaware + Fyre:
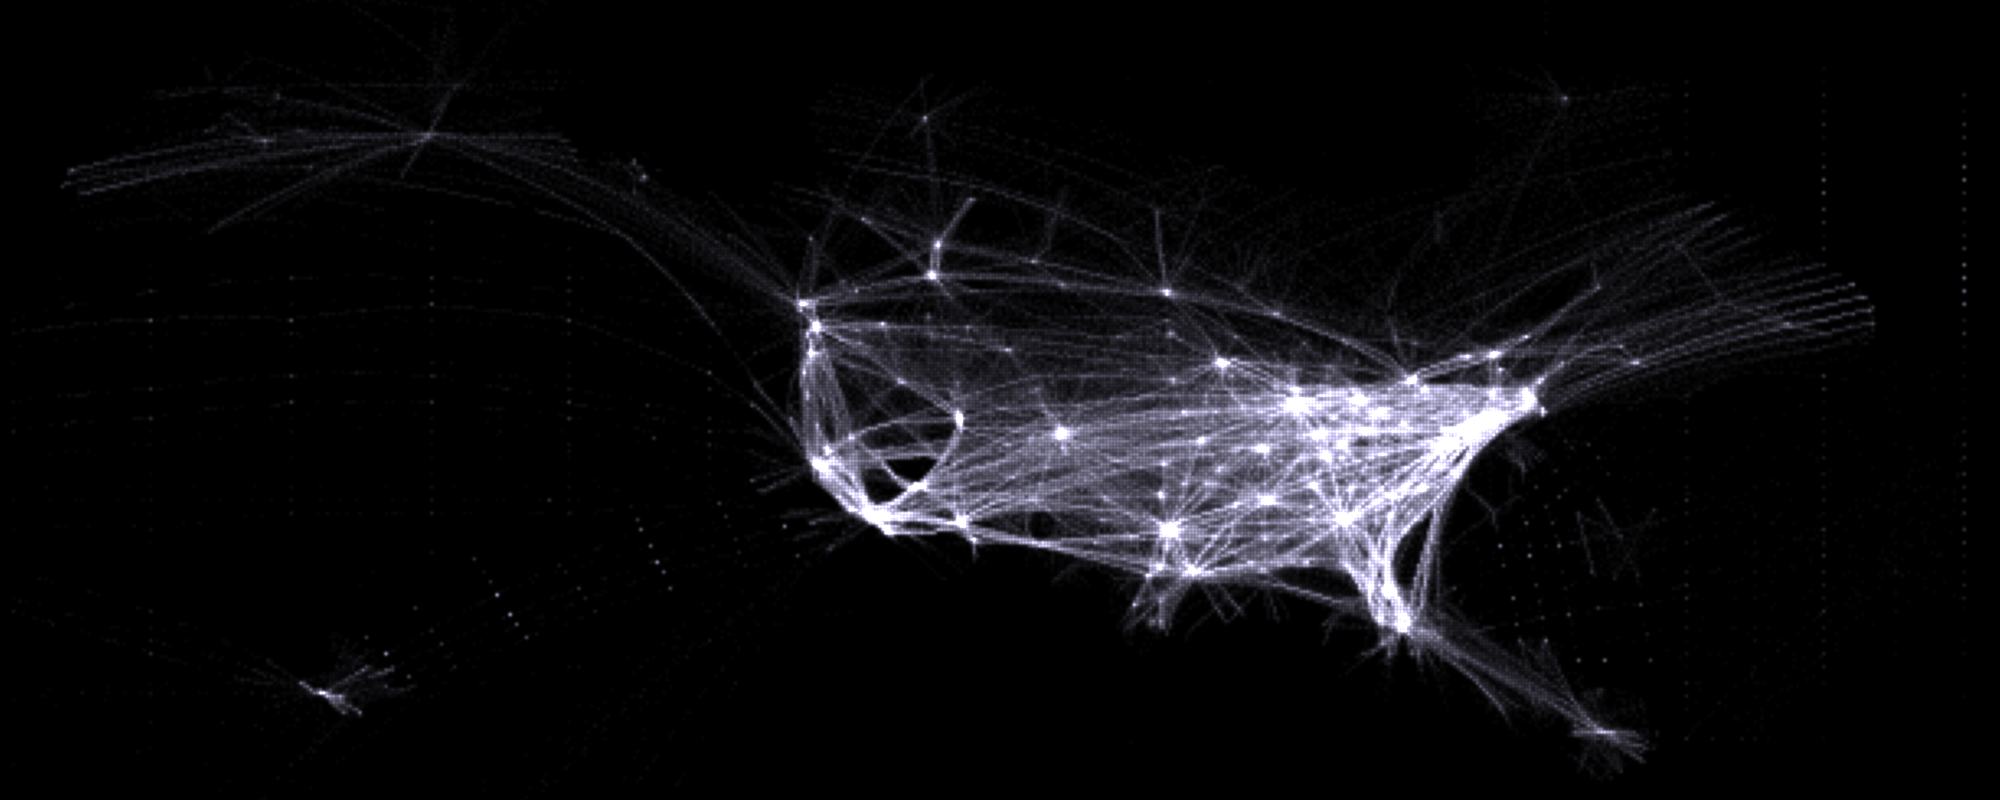
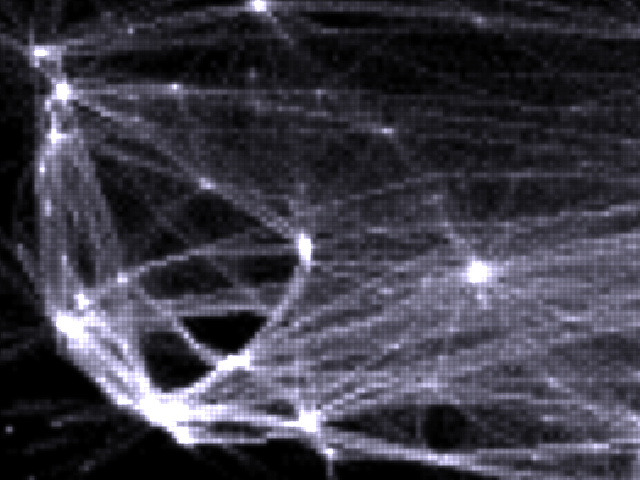
The above image is part of a histogram generated from Flightaware’s 24-hour time lapse. Click the link for the uncropped version. The original video is a Quicktime wrapper around individual PNG frames. I used mencoder to strip off the Quicktime wrapper, then a small Python script split the video streams into individual frames, decompressed them, and plotted a histogram of each red dot. The script generated a data file which was rendered using a patched version of Fyre 1.0 SVN.


