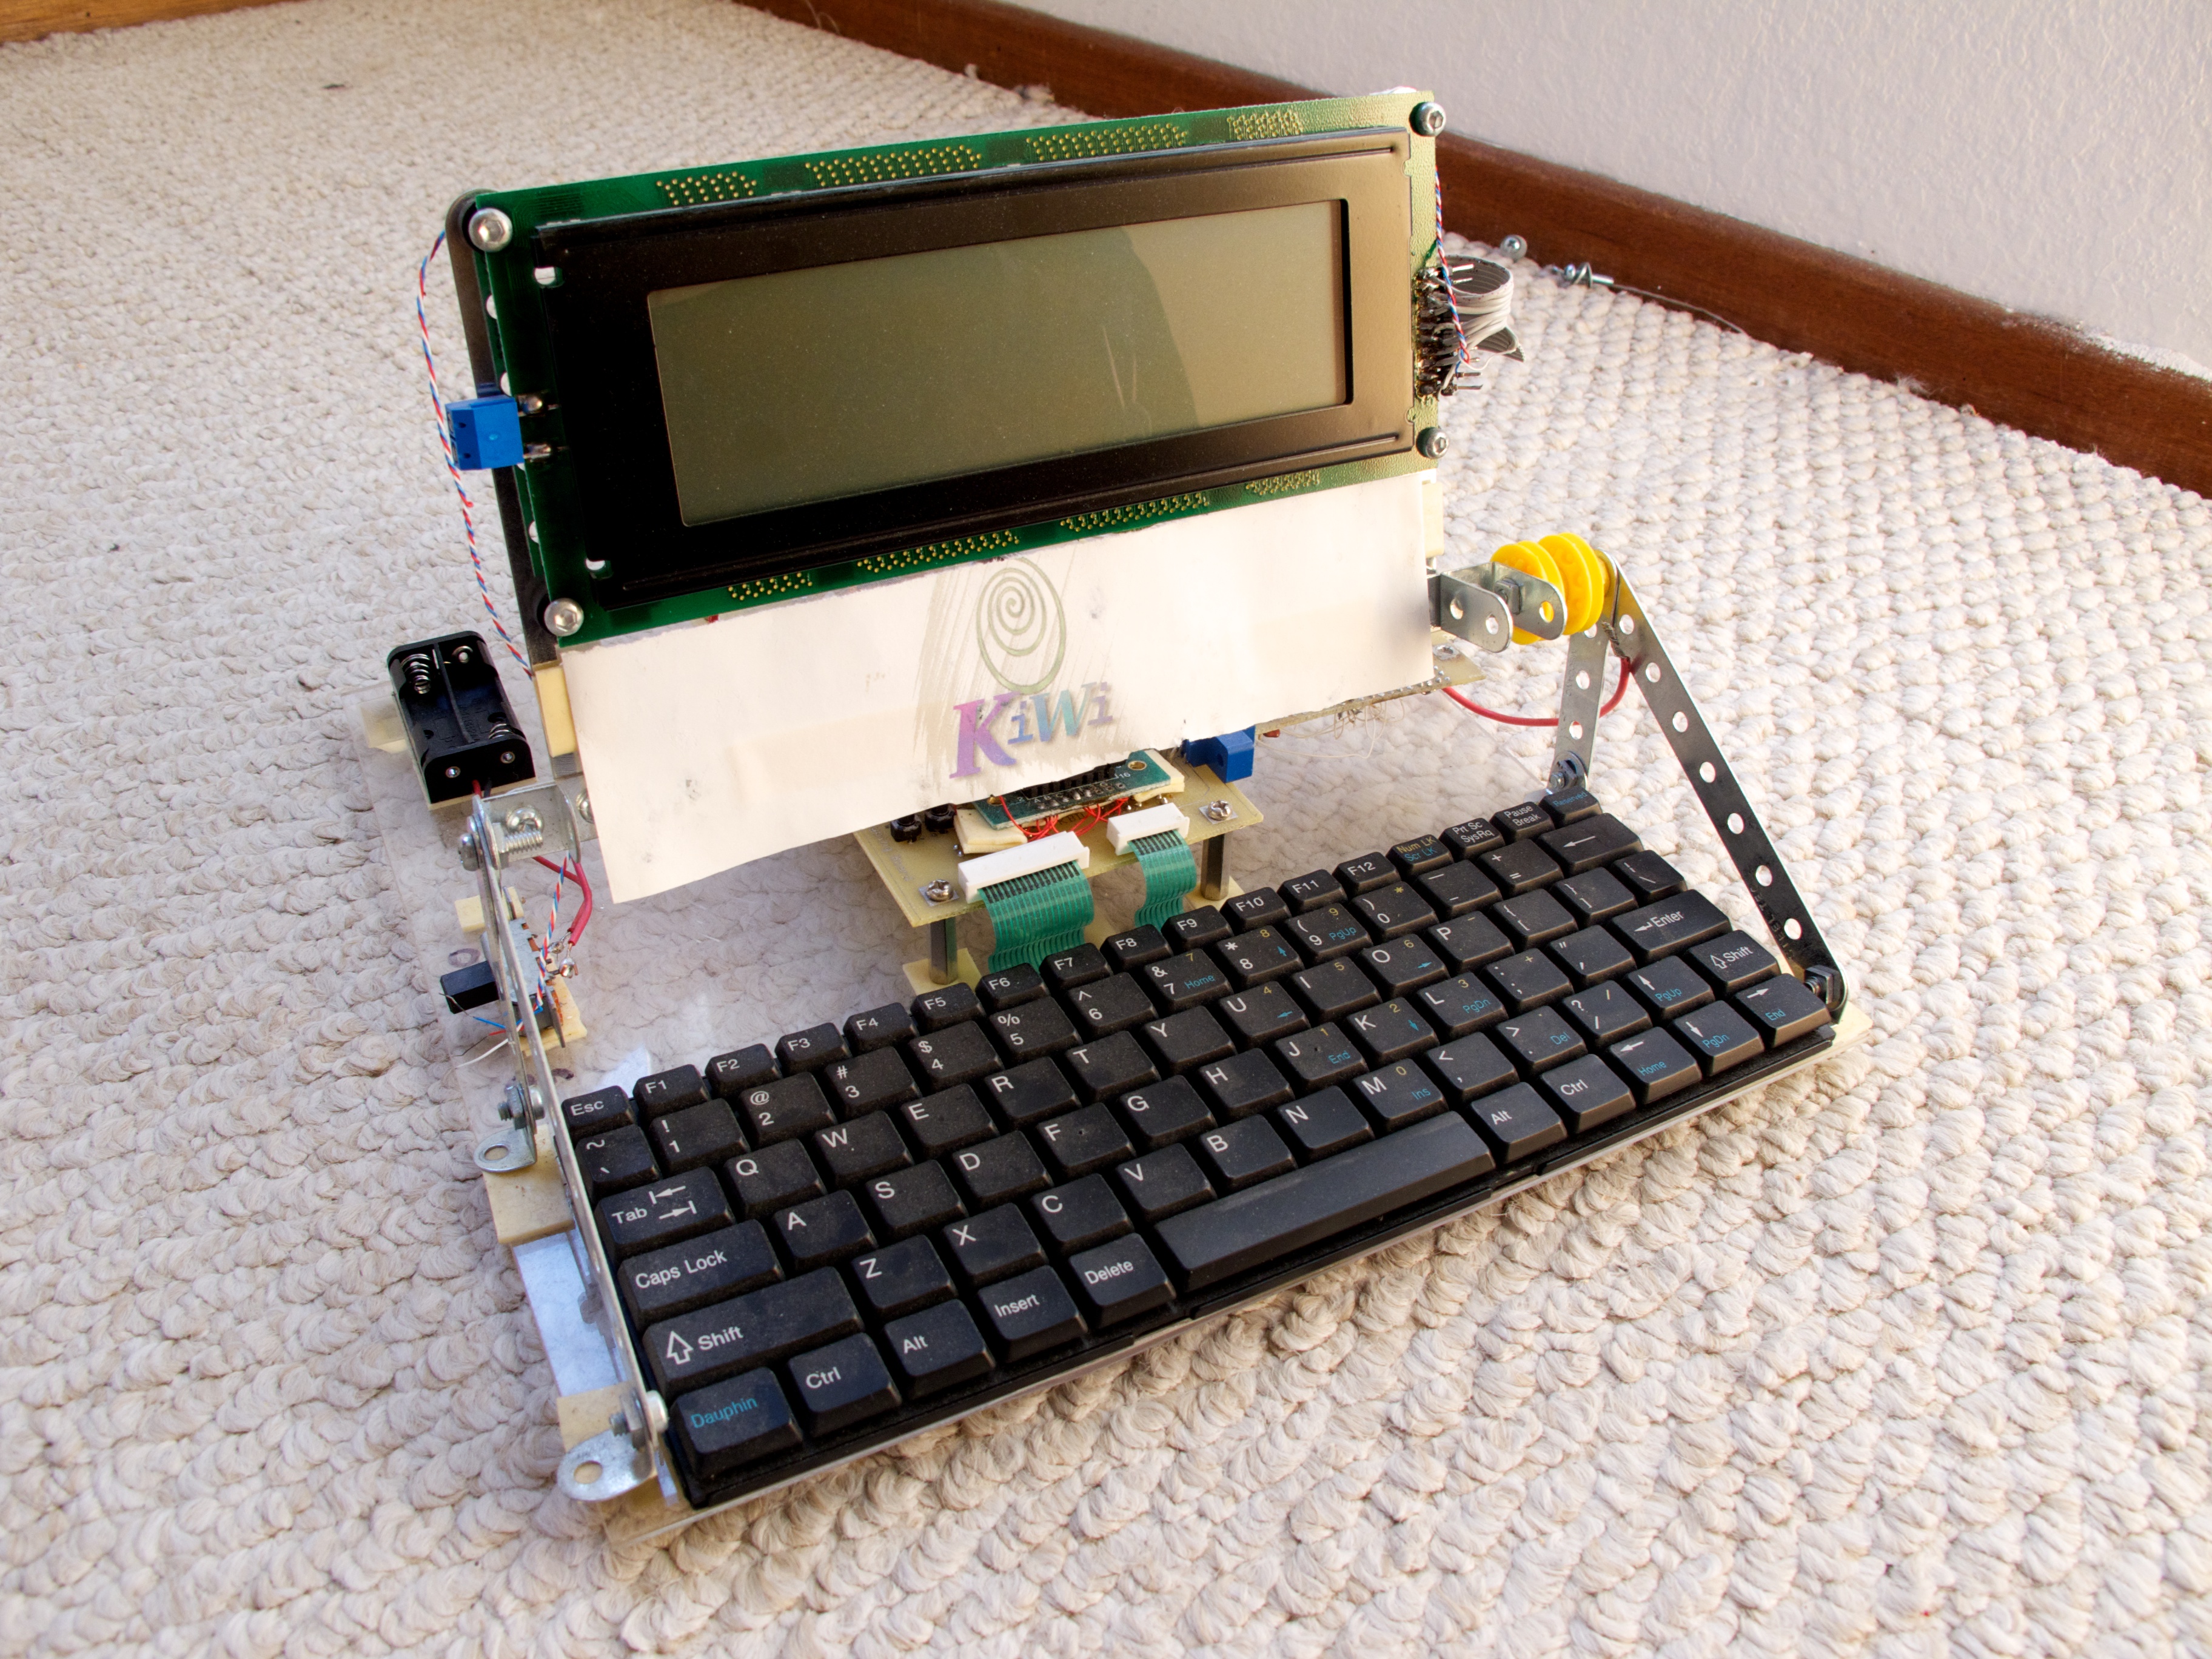
Kiwi

Another nostalgic post about an old project that I’m purging from my closet… This time from late-1999 through mid-2000.

The Kiwi was a rather ambitious built-from-scratch Linux PDA that I spent my high school years on. My original goal for this project was reminiscent of the One Laptop Per Child project. I liked typing my notes, but of course laptops were prohibitively expensive. I wanted to design a very simple PDA, with a keyboard, that I could sell to my classmates for $100 a unit.

[flickr id=”5920009823″ thumbnail=”medium_640″ overlay=”false” size=”large” group=”” align=”none”]

To reach that low cost, I needed something extremely simple:

  • A cheap 16 MHz system on a chip, the Motorola 68EZ328 “DragonBall”
  • Minimal amounts of DRAM and Flash
  • A cheap laptop-style matrix keyboard, sourced from a surplus shop.
  • Very low-resolution grayscale LCD, with no touch screen.

With these tight constraints, the project was actually more like a souped up AlphaSmart than a bare-bones PDA. It ran uCLinux, and I could use the uCSimm board to start prototyping the software. This project eventually led to the PicoGUI project, as I needed a special kind of GUI to fit such a small device. And developing PicoGUI led to starting the CIA.vc service.

[flickr id=”5920580416″ thumbnail=”medium_640″ overlay=”false” size=”small” group=”” align=”none”]

The Kiwi prototype was done with a hellish combination of a custom PCB, wire-wrapping, and dead-bug surface mount rework. The PCB acted mainly as an SMT prototyping adapter. All the real interconnection was done with wire-wrapping, as I didn’t trust my design enough to bake it into a PCB right away. Of course, the one thing the PCB was designed to do, it didn’t. So the DRAM chip and serial level-shifter ended up grotesquely blue-wired.

[flickr id=”5920577826″ thumbnail=”medium_640″ overlay=”false” size=”small” group=”” align=”none”]

Despite the mess, this machine did boot Linux. I wrote my own bootloader for it, which I used for initial hardware bringup. It booted the uCLinux kernel from flash, and ran PicoGUI on the tiny LCD. Like most of my projects, it was never finished. PicoGUI took over as the focus of my attention, and I targeted my GUI at larger and less haphazard platforms.

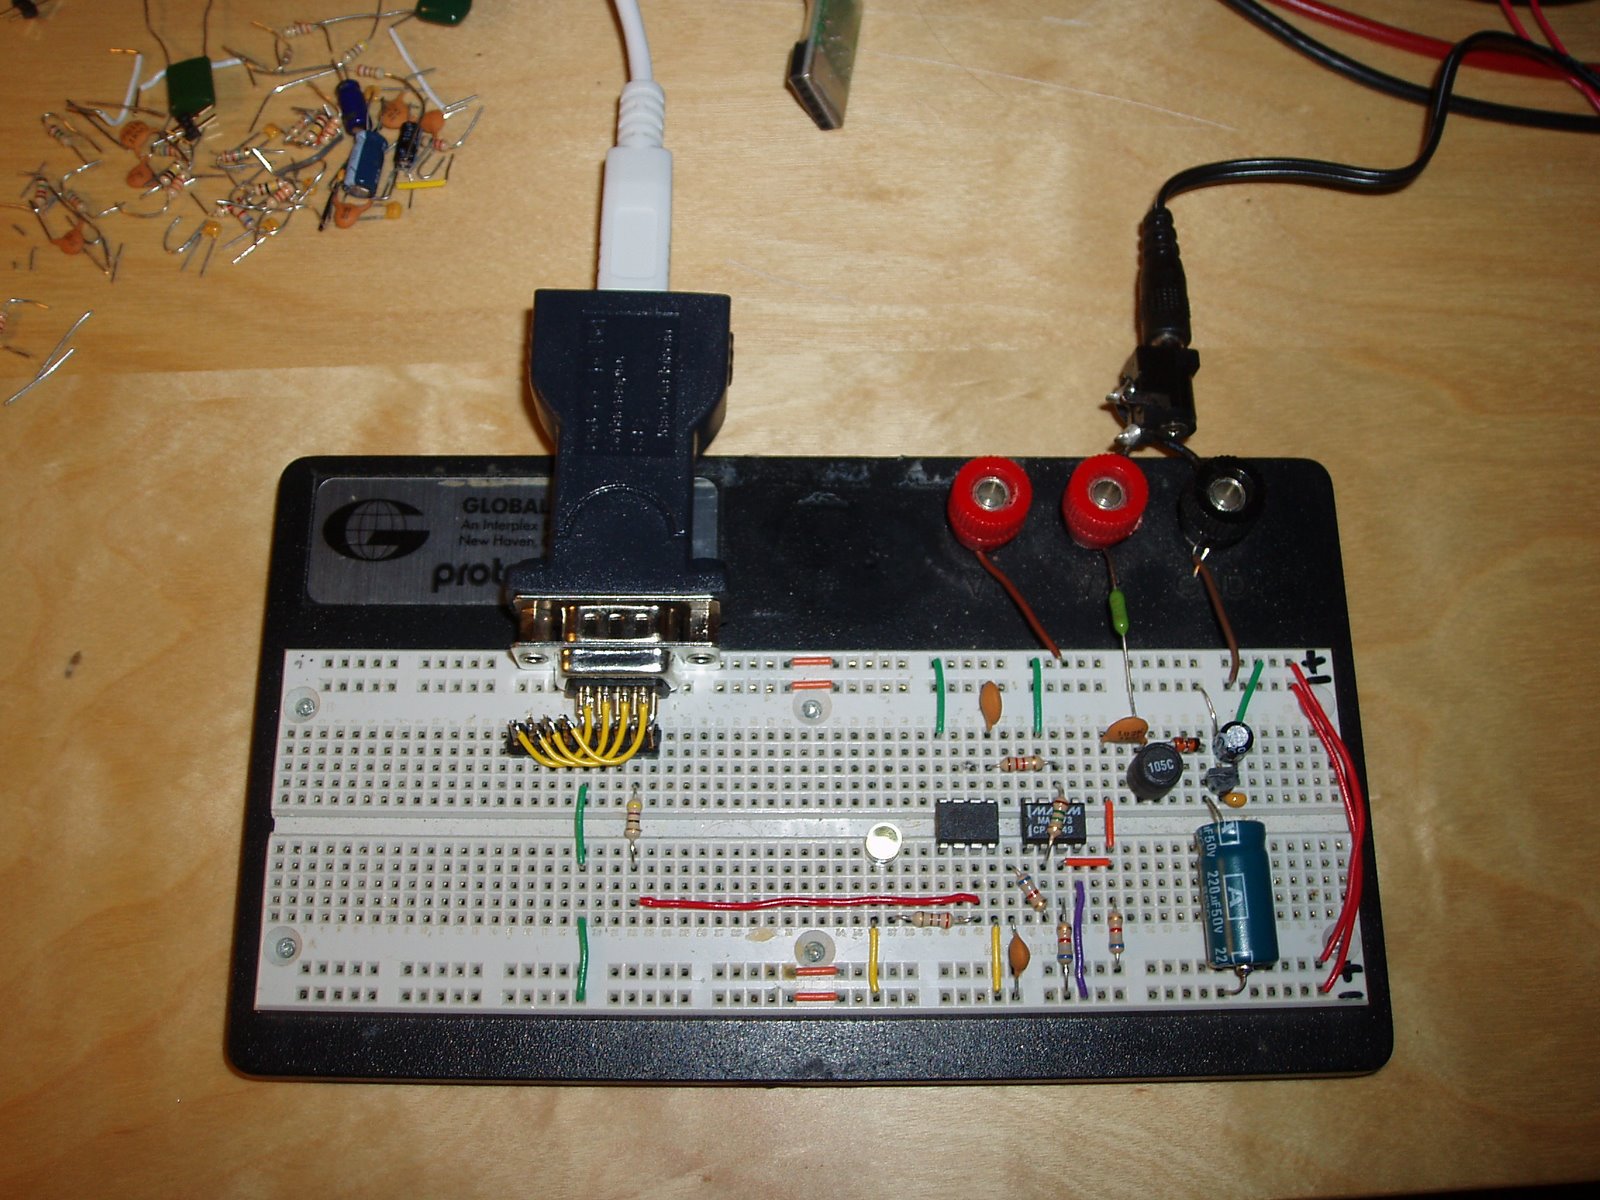
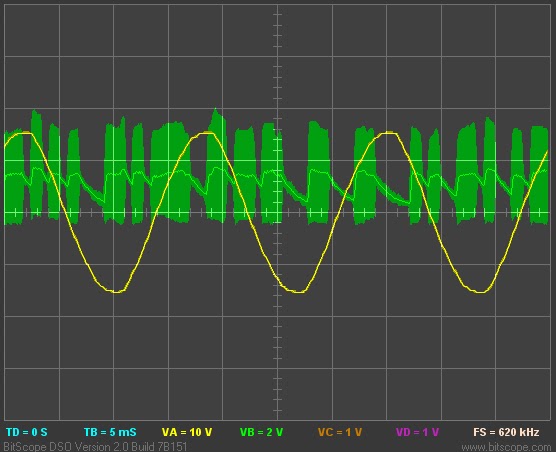
Self-contained TED receiver

My previous entry introduced a homebrew receiver for the powerline-based data protocol used by The Energy Detective. I just designed a second revision of that receiver. This one is self-contained: It gets power and modulated data from a 9V AC wall-wart transformer, and decoded data leaves via an RS-232 serial port at 9600 baud. Best of all the circuit is very simple: Just an 8-pin microcontroller and a single op-amp.

Major changes in this version:

  • DC power for the circuit is now provided by the 9V AC input, instead of a separate power supply. Previously this would have caused unacceptable levels of harmonic distortion in the input signal. In the new design, this is mitigated by an inductor (which forms an LC low-pass filter), and by the lower power consumption of a single modern op-amp versus three ancient op-amps.
  • By using a simpler filter design and a modern op-amp with a gain-bandwidth product of at least 10 MHz, the bandpass filter and amplifier can be built using only a single op-amp.

Note that the MAX475 op-amp I’m using has been discontinued by the manufacturer, and it’s now hard to find. I just used it because I had one handy in my junk drawer. I’ll verify this design with other op-amps as soon as I can, but it should work with just about any op-amp which can operate on a single-ended 5V supply, and which has a high enough GBW.

Firmware and schematics (PNG and EAGLE formats) are in Subversion and more info on the theory of operation was presented in my previous blog entry.

Interfacing with The Energy Detective

I recently bought The Energy Detective (TED), a pretty inexpensive and friendly way to keep tabs on your whole house’s electricity usage. It’s a lot like having a more featureful version of your utility company’s power meter, sitting on your kitchen counter. It can estimate your utility bill, and tell you how much electricity and money you’re using in real-time. The resolution is pretty good- 10 watts, 1 second.

As a product, I’ve been pretty happy with it. It does what it claims to, and the measurements seem to be fast and accurate. Of course, being the crazy hacker I am, I wanted to interface TED with other things. I don’t have a home automation system as such, but I did want to get real-time graphs of my electricity usage over various time periods. I also wanted the possibility to use TED as an information feed for various other display devices around the house. (But that’s a topic for another blog post…)

The stock TED package consists of two pieces: A measurement/transmit unit (MTU) and receive/display unit (RDU). The MTU has a pair of current transformers, and it installs entirely in your house’s breaker panel. It takes the power readings every second, and transmits them over the power lines to the RDU, which is just a little LCD panel that plugs into the wall. The RDU has a USB port, which you can use with TED’s “Footprints” software.

So, hoping that the USB port would do what I want, I bought the Footprints software for $45. The TED system itself is, in my opinion, a really good value. The Footprints software is not. As a consumer, I was disappointed by two main things:First of all- the UI lacks any polish whatsoever. It looks like a bad web page from the 90’s. Second of all, the data collection is not done in hardware, it’s implemented by a Windows service. This means you can’t collect data to graph unless you have a Windows PC running. Not exactly a power-efficient way to get detailed power usage graphs.

As a hobbyist, a few more things frustrated me about Footprints. The implementation was pretty amateurish. Their Windows service runs a minimal HTTP server which serves up data from an sqlite database in XML. The front end is actually just a Flash applet masquerading as a full application. Energy Inc, the company behind TED, has an API for Footprints: but you have to sign a legal agreement to get access to it, and I wasn’t able to get any details on what the API does and doesn’t include without signing the agreement. So, I opted not to. It would be much more fun to do a little reverse engineering…

So, I did. The end result is that I now have two ways of getting data out of my TED system.

Using the USB port

The TED RDU’s USB port is actually just a common FTDI usb-to-serial adapter. The RDU sends a binary packet every second, which includes all of the data accessible from the Footprints UI. This includes current power usage, current AC line voltage, utility rates, month-to-date totals, and anything else you’ve programmed into your RDU.

There has been some prior work on reverse engineering this protocol. The Misterhouse open source home automation project has a Perl module which can decode the TED messages.

Unfortunately, the Perl module in Misterhouse won’t work with more recent versions of the RDU like mine. The recent RDUs have a different packet length, and they require a polling command to be sent before they’ll reply with any data.

I found the correct polling command by snooping on Footprints’ serial traffic with Portmon. I also noticed a packet framing/escaping scheme, which explains some of the length variations that would have broken the module in Misterhouse.

The result is a Python module for receiving data from a TED RDU. It isn’t terribly featureful, but it should be pretty robust.

Direct from the wall socket

Now for the more exciting method: What about reading data directly from the power line, without using the TED receive/display unit at all? This could provide some exciting opportunities to embed a small and cheap TED receiver inside of other devices, and it would provide some insight on what exactly is being transmitted by the box in my breaker panel.

The TED RDU is pretty simple internally: A Dallas real-time clock, PIC18 microcontroller, chip-on-glass LCD, some buttons, and the TDA5051A, a single-chip home automation modem from Philips. This chip can receive and transmit ASK modulated signals at 1200 baud, with a carrier frequency of around 132 kHz.

Digi-key carries the TDA5051A, but I figured it would be more educational (and more hobbyist-friendly) to try and build a simpler receiver from scratch using only commonly available parts. The result is the following design, with an 8-pin AVR microcontroller and three op-amps:

Update: There is now a Revision 2 of the schematic, which uses only a single power supply and one op-amp.

  1. The power line is sampled via a 9V AC wall wart. With this design, it needs to be a separate isolated power supply. So far, I haven’t had any luck with using this same transformer to power the circuit. Any rectifier introduces high-frequency harmonics which drastically degrade the signal-to-noise ratio.
  2. The first stage is a 10x amplifier and 138kHz band-pass filter. This is from Texas Instrument’s “Filter Design in Thirty Seconds” cheat-sheet.
  3. The next stage is an amplifier and high-pass filter, to remove the last remnants of 60 Hz ripple.
  4. The third stage is just for amplification. In a design which used higher quality op-amps, this stage may not be necessary.
  5. After the third op-amp, the signal passes through an RC network which AC couples it, filters out high frequency noise which could cause glitches in the microcontroller’s I/O pin, and limits the current into the micro’s clamping diodes.
  6. At this point, we have an amplified digital signal which is still ASK-modulated:

The rest of the work happens in software. The ATtiny85 keeps itself quite busy:

  1. The AVR first applies a narrow digital band-pass filter, to strip out any ringing or other noise that remains after the analog band-pass filter.
  2. Next, a digital low-pass filter. This passes the 1200 baud serial data, but rejects higher frequency glitches.
  3. A threshold is applied, with hysteresis, to convert this data into a stream of ones and zeros.
  4. Next is a relatively typical software serial decoder, with majority-detect. The ASK modulated data has 8 data bits, 1 start bit, and 2 stop bits. Polarity is slightly different than typical RS-232. “1” is the presence of an ASK pulse, “0” is the absence of a pulse. Start bits are “1”, stop bits are both “0”.
  5. Using this serial engine, we receive an 11-byte packet.
  6. The packet is converted from TED’s raw format into a more human-readable (but still machine-friendly) serial format.
  7. The reformatted data is finally output via a software serial port at 9600 baud.

The end result, as viewed from a PC connected to the serial output pin:

HC=245 KW=001.324 V=121.138 CNT=023
HC=245 KW=001.335 V=121.135 CNT=024
HC=245 KW=001.348 V=121.072 CNT=025
HC=245 KW=001.345 V=121.021 CNT=026
HC=245 KW=001.345 V=121.044 CNT=027
HC=245 KW=001.324 V=121.152 CNT=028
HC=245 KW=001.314 V=121.280 CNT=029
HC=245 KW=001.314 V=121.306 CNT=030
HC=245 KW=001.311 V=121.297 CNT=031
HC=245 KW=001.349 V=121.232 CNT=032
HC=245 KW=001.347 V=121.228 CNT=033

The “KW” and “V” columns are self-explanatory. “HC” is my TED’s house code, and “CNT” is a packet counter. Normally in increments by one. If it skips any numbers, we missed a packet.

But wait, what’s wrong with this picture? The power and voltage readings have too much precision. The standard TED display unit will give you a resolution of 10 watts for power, and 0.1 volt. As my data above shows, the TED measurement unit is actually collecting data with far more precision. I can only guess why TED doesn’t give users more precision normally. I suspect they removed it because the extra precision may imply extra accuracy that may not exist.

So, what is TED actually sending? Once a second, it broadcasts an 11-byte packet over your power lines at 1200 baud:

  • Byte 0: Header (always 0x55)
  • Byte 1: House code
  • Byte 2: Packet counter
  • Byte 3: Raw power, bits 7-0
  • Byte 4: Raw power, bits 15-8
  • Byte 5: Raw power, bits 23-16
  • Byte 6: Raw voltage, bits 7-0
  • Byte 7: Raw voltage, bits 15-8
  • Byte 8: Raw voltage, bits 23-16
  • Byte 9: Unknown (Flags?)
  • Byte 10: Checksum

Pretty straightforward. I don’t know the actual A/D converter precision in the measurement/transmit unit, but both the power and voltage readings are sent on the wire as 24-bit raw numbers. I’m still not sure what byte 9 is. In my measurements, it hovered around 250, sometimes jumping up or down by one. It may be some kind of flag byte, or maybe it measures power line frequency? The checksum is dead simple: Add every byte in the packet (modulo 256), and the checksum byte ensures the result is zero.

To figure out what to do with these raw measurements, I collected data simultaneously with my circuit and with the TED RDU’s USB interface. Both sets of results went into a spreadsheet. After removing outliers, I did a linear regression. The resulting linear function is what you’ll find in the current firmware for my homebrew receiver. The following plots from the spreadsheet are a pretty striking illustration of the additional precision available via my raw interface:

The top graph shows power line voltage as recorded by the TED RDU. The second graph shows the raw values I’m receiving from the TED MTU. The bottom graph shows the correlation between the two, in blue, and my linear regression, in red.

I plan to keep improving the circuit. Hopefully there’s a way to get both data and power from a single supply, without dealing with any annoying high-voltage circuitry. If there is any interest, I might make a kit available. If you’re interested, post a comment and let me know what features you’d like. USB port? Serial port? Display?

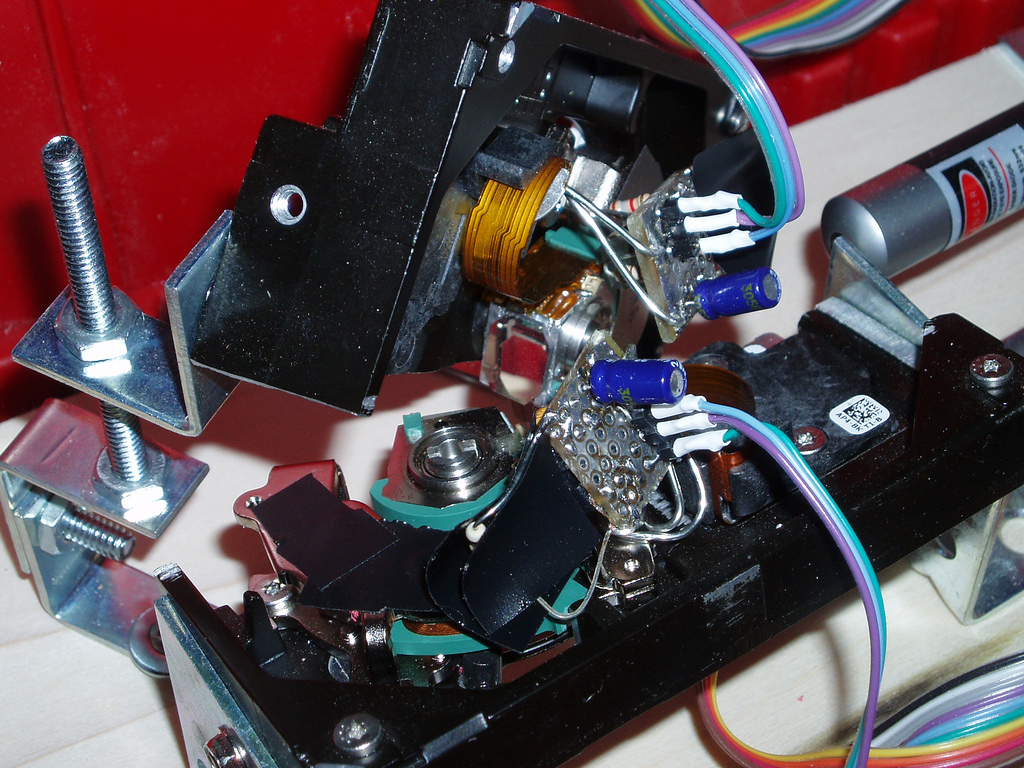
Hard disk laser scanner at ILDA 4K

I should have blogged about this long ago, as I’ve been working on it off and on for about three months now, but today I reached an arbitrary milestone that compels me to post 😉 I’m still actively working on this project, so I’ll try to make updates occasionally, and if I end up putting together an actual project web page I’ll link it from here.

My latest tinkery hardware and embedded systems project is a homebrew laser scanner. You know, the kind you see at planetariums- sweep a laser beam around on the wall really fast, and draw vector graphics. Commercial laser scanners have been around for decades now, but buying a complete system is still really pricy, even on eBay. Besides, where’s the fun in that?

There are plenty of examples of homebrew laser scanners on the internet. Many people have wired up a pair of loudspeakers, hard disk actuators, or other readily available mechanisms to an amplifier and used them for simple laser graphics. This will make some pretty wiggly patterns on the wall, but it isn’t a real vector graphics display. The best example I know of for a totally built-from-scratch laser projector (not using commercial galvo actuators) actually uses custom hand-wound galvanometers. Very nice.

So, this has been done before, but I still find it an interesting project. This is actually my third attempt at a laser scanner. My first one I built when I was in my early teens, when solid state lasers were first starting to become “affordable”. I pointed my shiny new $40 laser diode module, dimmer than today’s $5 laser pointer, at a few spinning mirrors on cheap DC motors. Instant laser spirograph, with basic speed control over the parallel port of my 8086 PC.

About 4 years ago, in college, I made my second attempt. This one used a cheap red laser pointer, fragments of scrap mirrors, and a couple of old hard disks hot glued together. The mechanical parts were shoddy, but the electronics were worse. It had an extremely low-power open loop amplifier, and it couldn’t draw much more than circles.

This being my third try, I figured I had to get it right. I still stuck to my original goals:

  • Only readily available off-the-shelf mechanical and electronic parts.
  • Simple hardware, powerful software.
  • Performant enough to display low- or medium-complexity vector graphics.
  • Portable.

And, this was the result:

To differentiate it from all the other hobby laser projectors out there, it has a pretty nice set of features:

  • Compact and portable.
  • All digital. In the whole project, no board-level analog signals are present.
  • Based around the Parallax Propeller multi-core microcontroller.
  • Optical position sensors, for closed-loop servo feedback.
  • High-power 30mW green laser, with software-adjustable brightness level.
  • Bluetooth interface. The only external wire is power.
  • Vector graphics virtual machine. To efficiently send graphics data over the relatively slow Bluetooth link, frames can be encoded using a simple instruction set which lets the projector itself perform line and curve interpolation.

The internals:

  • Two hard disk voice coil motors (VCMs) with front-silvered mirrors.
  • Position sensors: Each consists of two LEDs (one stationary, one moving) and a TSL230R light-to-frequency converter chip.
  • Temperature sensors: Dallas DS18B20 1-wire sensors, mounted on the magnet bracket for each VCM.
  • Laser module: A dangerously bright 30mW green laser from DealExtreme.
  • Control electronics: A Propeller prototype board with two LMD18200 H-bridges to drive the VCMs, a Darlington transistor to drive the laser, Bluetooth module from Spark Fun, and a few resistors and capacitors. That’s all.

So, the hardware is really simple. Building this projector involved a lot of cutting, gluing, and soldering- but building a second one could probably be done in a weekend. The complexity is in the software, and especially the firmware. The on-board microcontroller is responsible for reading and filtering the light sensor data, updating the servo loop for each VCM at 40 KHz and generating pulse-width modulation at several MHz, reading the temperature sensors, generating laser brightness control PWM at up to 80 MHz, decoding the vector graphics instruction stream, communicating over the Bluetooth link, and supervising the whole operation so we don’t melt a VCM coil or shear any end-stops in half- all simultaneously. The Propeller, luckily, has 8 symmetric processing cores. This project keeps all of them busy.

I’m just barely at the point where I can start conducting meaningful testing that shows me the projector’s true limits. The hardware and firmware are feature-complete, but the desktop software does little more than provide a pretty wxPython UI for high-level control and calibration. So far I’ve been testing it with simple hand-drawn shapes, which the control software can resample for constant laser velocity.

Today I wrote an importer for the ILDA Image Transfer Format, and tried running the industry-standard ILDA Test Pattern. The pattern is designed for a speed of 12K (12000 points per second), but modern commercial laser scanners can typically run it at 30K or higher.

Well, it looks like my projector currently maxes out at about ILDA 4K. Compared to a modern commercial scanner, this sucks, but it’s not bad for a couple of hard disks. I’ll have to try tweaking my servo loop some more (or cranking up the VCMs from 12 volts to 24, maybe with liquid cooling 😉 to see if I can go any faster, but this is certainly enough precision and speed to draw words, shapes, and hopefully some simple animated characters. (Kirby, Yoshi, maybe a spinning Parallax Propeller beanie…)

I’ll keep working on the software, and posting new photos as I make progress. The latest firmware (written in Spin and Assembly) and client software (in Python) are available in Subversion, with an MIT-style license.