

After building some hardware to trace and inject data on the Nintendo DSi’s RAM bus, it became obvious pretty fast that there’s a lot of data there, and (as far as I know) no good tools for analyzing these sorts of logs.
The RAM tracer has already given us a lot of insight into how the DSi works by virtue of letting us inspect the boot process, the inter-processor communication, and most of the code that runs on the system. But all of that knowledge comes in an indirect way, from using the RAM tracer as a platform to run other experiments. I’ve been interested in figuring out whether there’s a way to use the RAM trace itself to help understand a system’s dynamic behaviour.
The RAM is on a packet-oriented bus, so it would make sense to have a tool that looks kind of like a packet-based protocol analyzer. Think Wireshark, but for memory.
But there are also a lot of complex patterns that show up over time. As the DS loads a file, or initializes itself, or renders frame after frame of a UI, there are obvious patterns that emerge. So it also might make sense to have a visual tool, like vusb-analyzer.
Unfortunately, both of these approaches ignore the spatial organization of memory. The bus is a stream of packets that say ‘read’ or ‘write’, but the contents of RAM as a whole is more like a file that’s changing over time. Like in a version control system.
So the tool I’ve been imagining is kind of a hybrid of these. It would have a graphical timeline that helps you visually navigate through large datasets and identify timing patterns. It would have a packet-by-packet listing of the reads and writes. And most importantly, it would be a hex dump tool. But instead of showing a hex dump of a static file, it would be a two-dimensional hex dump. The hex dump shows space, but you can also scrub forward or backward in time, and watch the hex dump change. The hex dump could be annotated with colors, to show which data is about to change, or which data recently changed. You could right click on a byte, and see hyperlinks to the memory transactions that are responsible for that byte’s previous and next values.
As far as I know, nobody’s written a tool like this. So I have no idea how useful it will actually be for reverse engineering or performance optimization, but it seems like a promising experiment at least. So far I’ve been working on an indexing and caching infrastructure to make it possible to interactively browse these huge memory dumps, and I’ve been working on the visual timeline widget. Here’s a quick screencast:
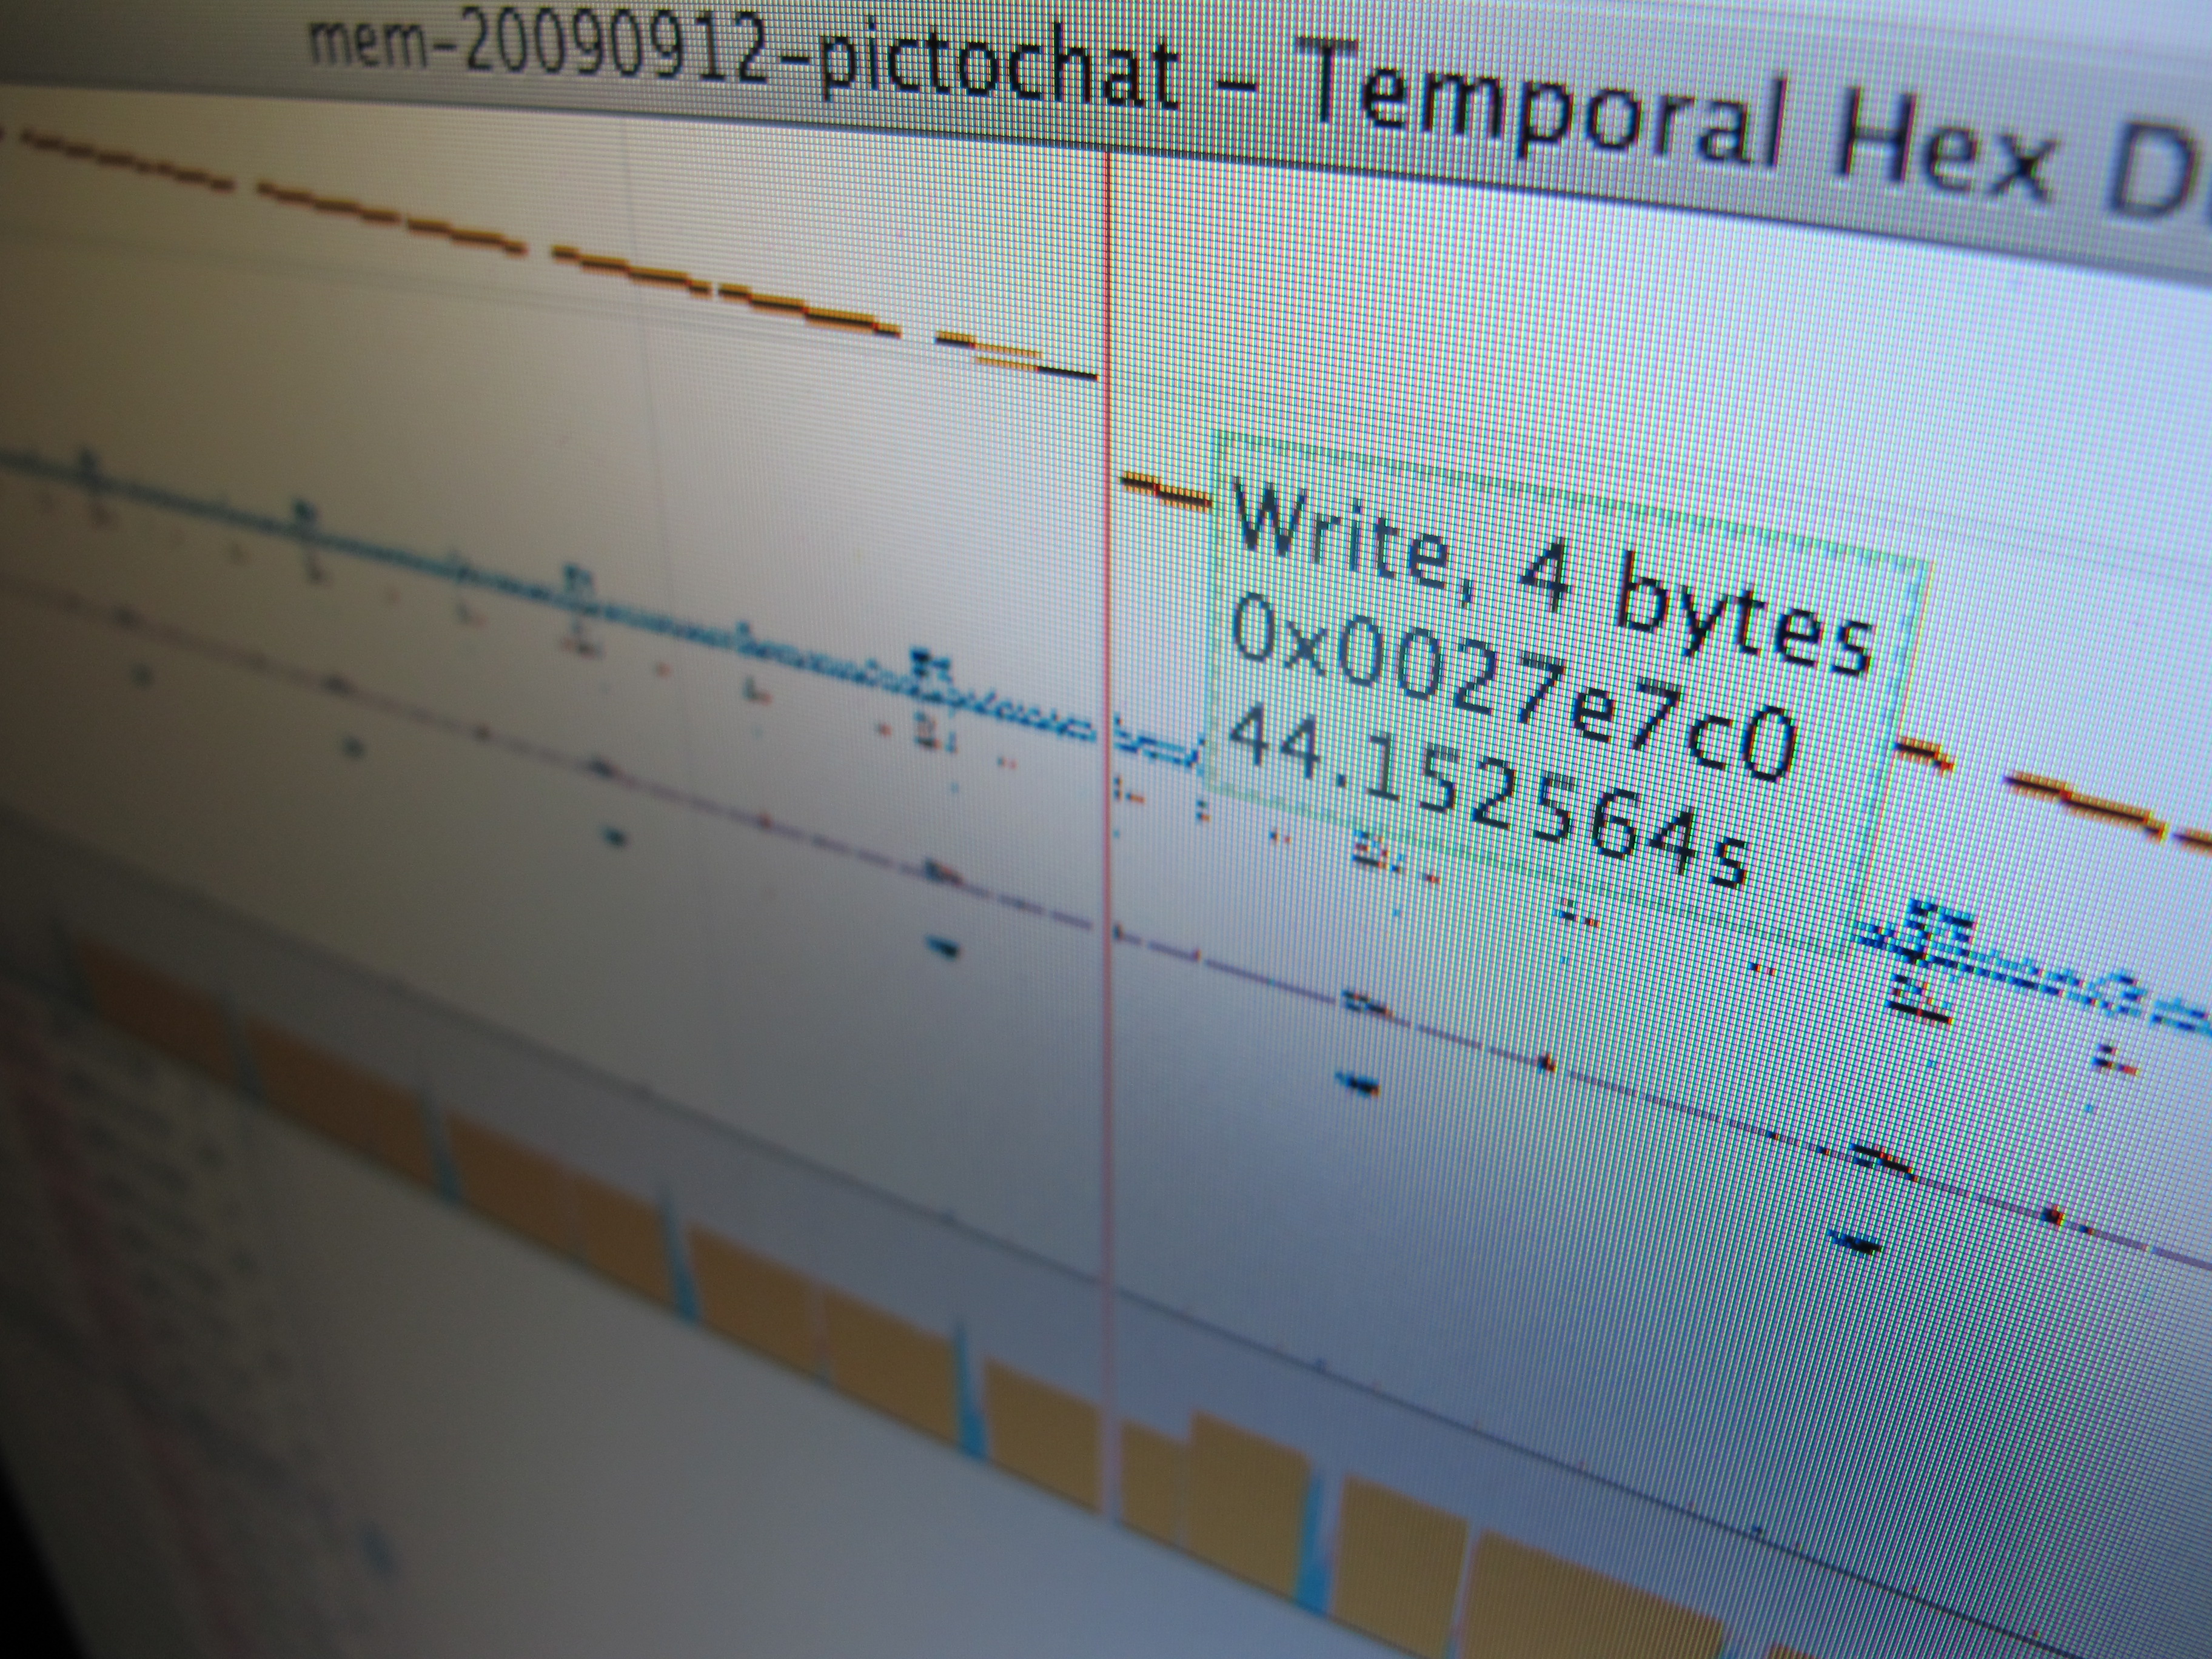
The top section shows read/write/zero activity binned by address, with each vertical pixel representing about 64 kB. The horizontal axis is time, with continuous zooming. The bottom section of the graph shows bandwidth, color-coded according to read/write/zero. Blue pixels are reads, reds are write, and orange is a write of a zero byte.
This log file is about a gigabyte of raw data, or about 2 minutes of wallclock time. It shows the Opera browser on the Nintendo DSi loading a very large web page, then crashing. You can see its heap growing, and you can watch the memory access patterns of code, data, and inter-processor communication.
There’s a lot of room for improvement, but I’m optimistic that this will be at least a useful tool for understanding the DSi, and maybe even a more generally applicable tool for reverse engineering and optimization.
As usual, the source is in svn if anyone’s interested. It’s implemented with C++, wxWidgets, sqlite3, and Boost. I’ve only tested it on Linux, but it “should” be portable.